Data is always talking and changing, it's your job to listen and listen well. Data is the fundamental language of Salesforce. When reporting and dashboards are properly configured and used, the Salesforce cloud fosters effective management, optimal resource utilization, proactive finances, and other good behaviors that are vital for businesses.
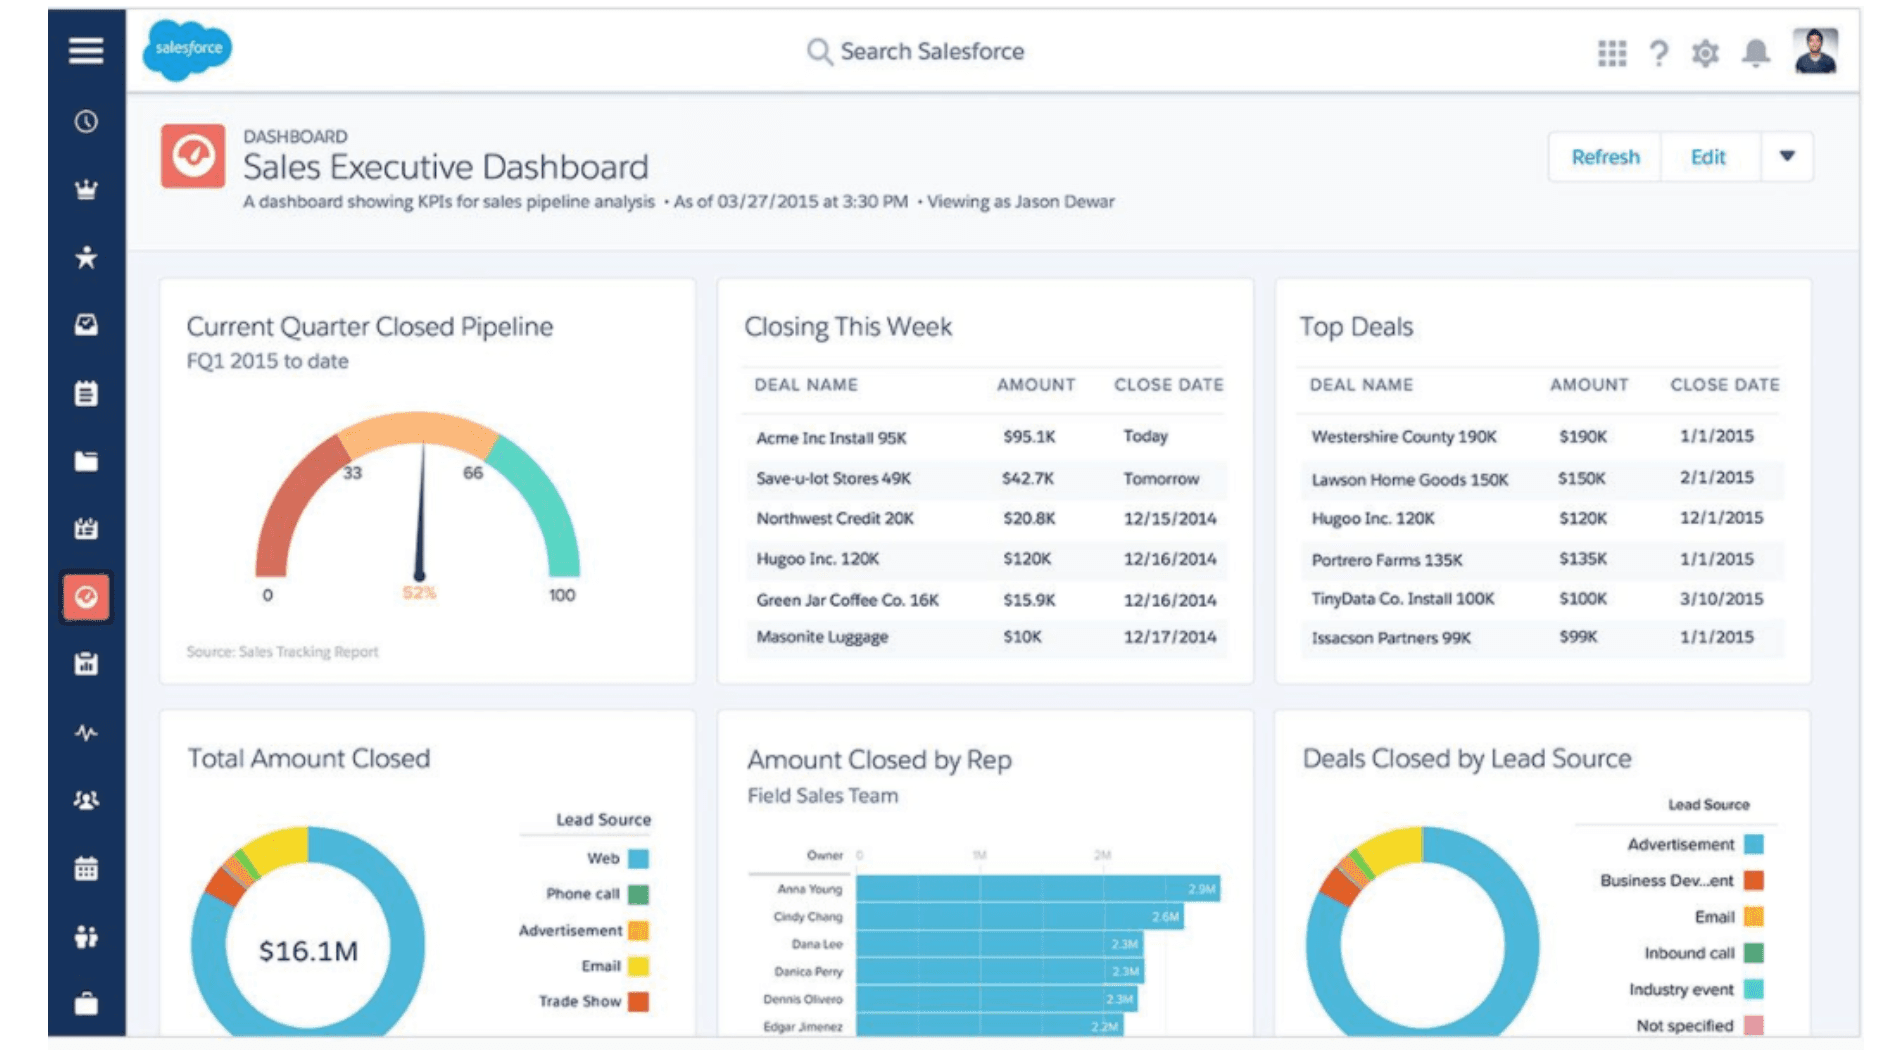
Much like your car's dashboard, a Salesforce dashboard visually provides information- quickly and easily. Dashboards can be created for anything that you are tracking in Salesforce. They can even be customized for different business units or job roles. In this post, we’ll explain some basics of Dashboards in Salesforce and then review some common elements in a Sales dashboard.

Understanding Salesforce Dashboards
The first step in building or customizing your dashboards is to understand your goals. So first answer the following questions. And if you’re not building the dashboard for yourself, make sure to ask the people that will use it for their input.
- What is the purpose of the dashboard?
- Putting together dashboards for no reason essentially dooms them to go unused. Before starting this process make sure you’re clear on why you’re creating the dashboard.
- Who needs to see it?
- This helps set up the correct sharing in the dashboard folder but also can help you when you’re deciding exactly how to filter a report.
- How often will it be used?
- Designing dashboards around metrics that are needed in regular meetings can be one way to ensure they are used. If your team has a status call ask if you can sit in and see what metrics are already being shared.
- What time period is relevant for the reports?
- A lot of dashboards will have some reports about the present state and some historical metrics. Make sure you clarify what time period may be relevant for any historical data. Too short of a period and you may not have any data, too much of a period and there may be too much to easily analyze.
- What business questions will it answer?
- This is really the key way to think about all the components on the dashboard. List out the questions that people want to be answered and then figure out the right data to support it.
After you answer these questions we recommend drawing a mockup of a dashboard. A spreadsheet, whiteboard, or a piece of paper and pencil all work well as easy ways to mock-up dashboard ideas.
Example: Setting up a Sales dashboard
Sales dashboards can vary drastically from one organization to another. If you’re a field sales organization you may be measuring meetings set, if you’re doing inside sales you may care more about calls, emails, and converting leads. We’ve probably set up thousands of dashboards at this point and rarely see two dashboards that look similar.
To streamline what you want on your dashboard, consider the following:
- Which metrics come up often in your reports?
- In your meetings with the team, do workers consider one metric as more important than another?
- Do you have multiple teams?
- What do you consider as your key performance indicator?
You may also consider including the following in your dashboard;
- Individual salesperson performance
- Product performance
Here are some ideas for dashboard components that can help your sales and marketing team.
Won Opportunities
Won Opportunities can be displayed in a number of ways and is always one of the metrics used for sales results. You can add it as a simple revenue figure for a certain period of time (e.g. Won opportunities this quarter), you can list out the biggest deals you’ve won recently, or show a trend report of closed deals over time. This is also a good report for grouping by salesperson, region, or product line to show variations between groups.
Open Opportunities
AKA the Sales Pipeline, this is another very common metric for a sales dashboard. If you group open opportunities by stage you can easily create a pipeline chart, or group by close date and sum the revenue to create a forecasted revenue chart.
Opportunities past due
Particularly for salespeople that handle a large volume of deals, past-due opportunities are a possibility. Your aim should be to keep this as minimal as possible so that you can use the close dates for forecasting.
Open activities
This includes your to-do list, open tasks, and routines. These could include activities that ensure the smooth running of day-to-day business. It helps stay proactive in your sales efforts and schedule your time more effectively.
Leads via their source
Having an understanding of where customers are coming from is vital. For instance, does your clientele come from referrals, sign-ups, conferences, meetings, or personal conversions? Gaining this information is vital to classifying which leads come first and how you should handle them.
Sales Forecast
Adding forecast categories to an Opportunity report helps businesses to know the sales forecast per time. It also helps to track the current progress and where they want to be. This does require that you set up one of Salesforce’s forecasting tools and have reps and managers fill out the forecasts.
Sales Leadership Charts
This fosters healthy competitiveness or competition amongst employees in the display of the current top sales personnel. In addition to this, it makes day-to-day activities less boring. The purpose of a leaderboard dashboard is to focus on sales performance that keeps managers and their teams closer.
Conclusion
Salesforce dashboards help in the daily activities of any business- from low-level businesses to top-tier management. A downside of the dashboards is that they are almost always based on available data from the database. On the market, you will find numerous software that provides consistent and reliable solutions to data management. They ensure that there is data in the desired destination per time. Furthermore, they expose weak points and how to turn them into strengths effectively. By taking advantage of this, you can make informed decisions and more sales.
With the dashboards reports are always connected. If you want to explore more on this topic please visit the “Salesforce reports can help your marketing and sales team” blog post.
If you would look for the tool that is sending unlimited reports outside Salesforce, check the Report Sender app on AppExchange.
Related Articles
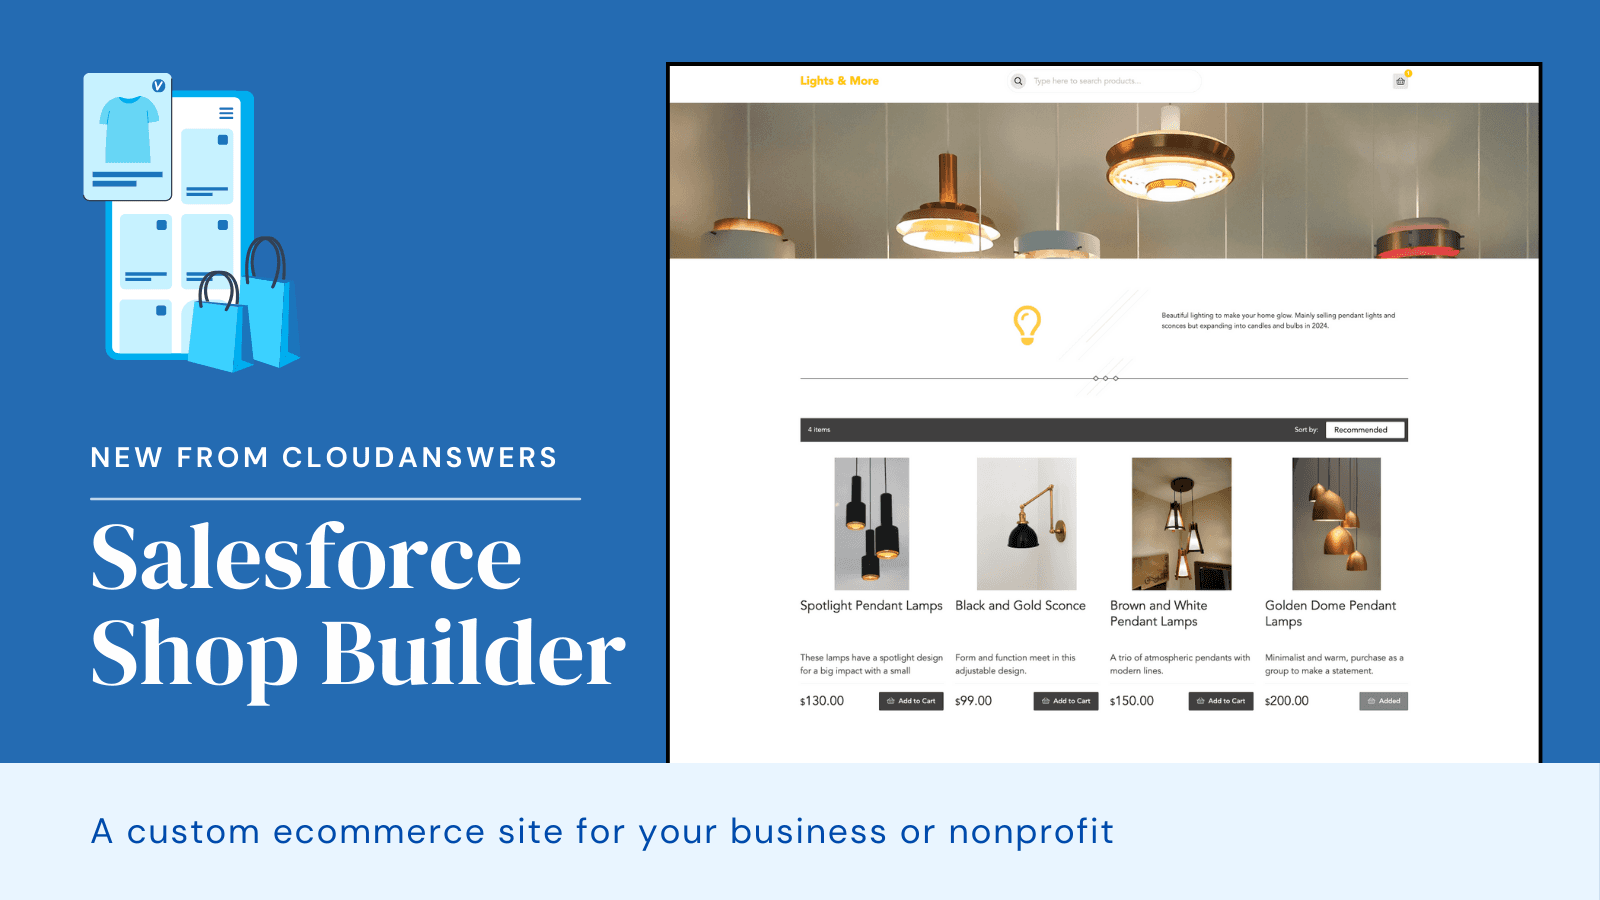
Product Launch: CloudAnswers Shop Builder
Are you looking for an easy way to launch an ecommerce shop? Our new app, Shop Builder, is now in public beta! We’re looking for companies that want to build an online shop but don’t want to spend thousands building it out.
April 12, 2024
5 Min Read
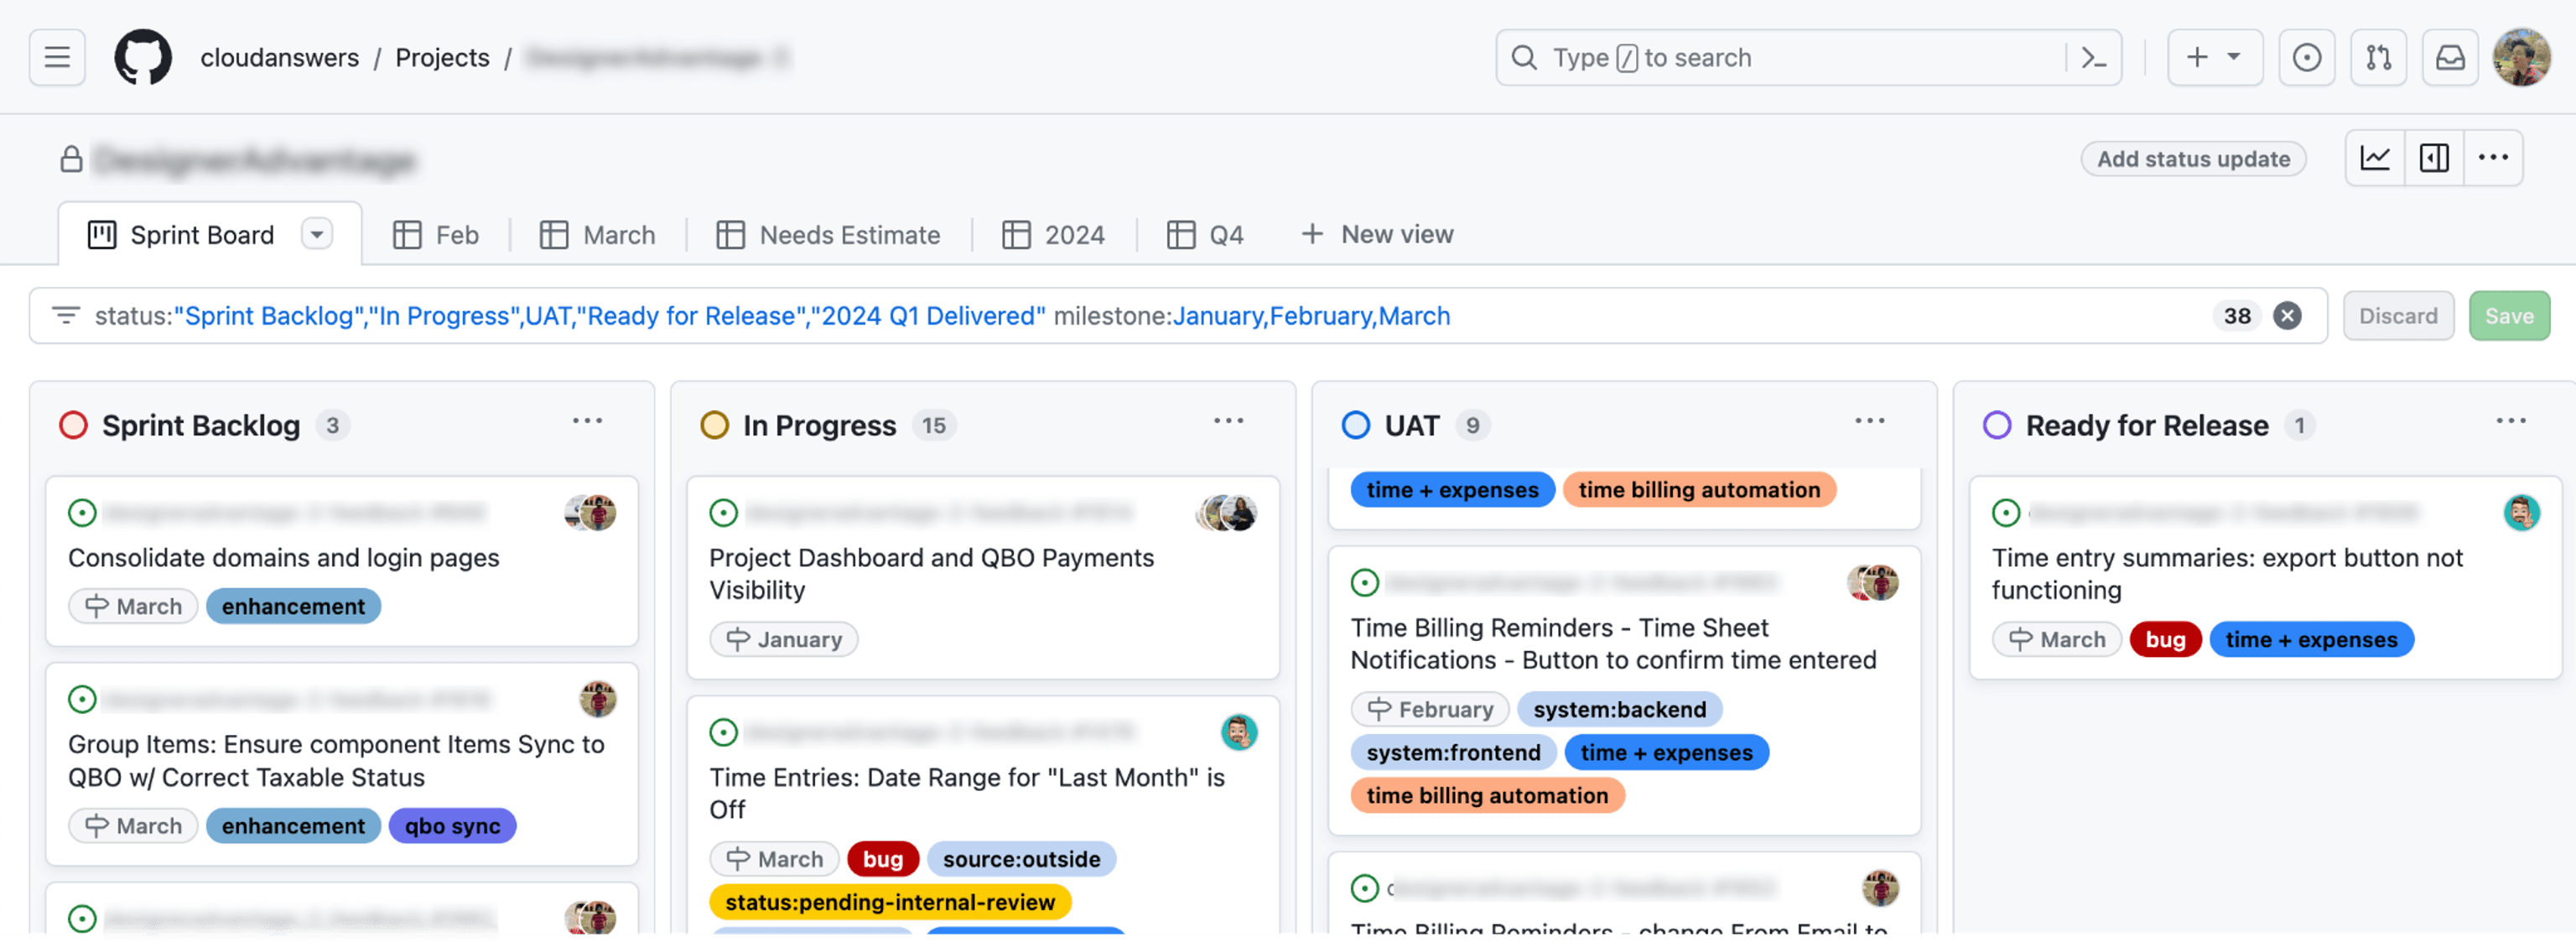
A Day in the Life of a Project Manager at CloudAnswers
I'm Emily, and I've been a project manager at CloudAnswers for the last two years. It can be a nebulous role, but I like to say I act as a bridge between the product vision and tangible results, whether that is building a custom app for a client or one of our own Salesforce products. My typical day revolves around managing tasks, ensuring progress, and maintaining standards while adhering to project timelines.
March 22, 2024
5 Min Read
Create a Custom Lightning Component for Alert and Confirm Dialogs
As front-end developers, there can be numerous instances when we need to display a prompt, a confirm dialog, or a confirm dialog with some input control to accept some value from the user. If you happen to be a Salesforce developer reading this article, you must have had such a requirement while writing lightning components.
March 4, 2024
6 Min Read

Newsletter
Company
Get in touch
Locations: Denver, Hartford, Portland (Maine), Wrocław, Chernivtsi, Zaporizhzhya
Email: help@cloudanswers.com
Phone: +1 617 229 5109