At CloudAnswers, we have decades of combined experience building sales reports. With the launch of Report Sender, we often get asked for help creating certain types of reports. In this blog, we’ll be talking about one of our most common requests, sales activity reports. These are reports that keep track of all of the KPIs that may affect revenue but aren’t just revenue reports – lead flow, sales outreach, key events.
Since everyone uses Salesforce differently, we’ll try to keep the examples pretty simple. But make sure to customize this based on how your team uses Salesforce. And if you can’t get the metrics you want, this is a great time to talk to the team about changing what data is in Salesforce.
What should be included in a Sales Activity Report in Salesforce Sales Cloud?
Open activities, completed activities, multi-person events or outstanding approval requests for which you are a delegated approver are all examples of common activity reports and there are templates (or report types) for you to get started on creating any of these on the Reports tab in Salesforce. For all the reports we talk about today, you’ll want to make sure you start with the correct report type, anything else can be edited after creating the report.
Creating an Activity Report
To create a sales activity report, do the following:
1. After logging into your Salesforce account, go to the “Reports” section and select the “New Report” option.

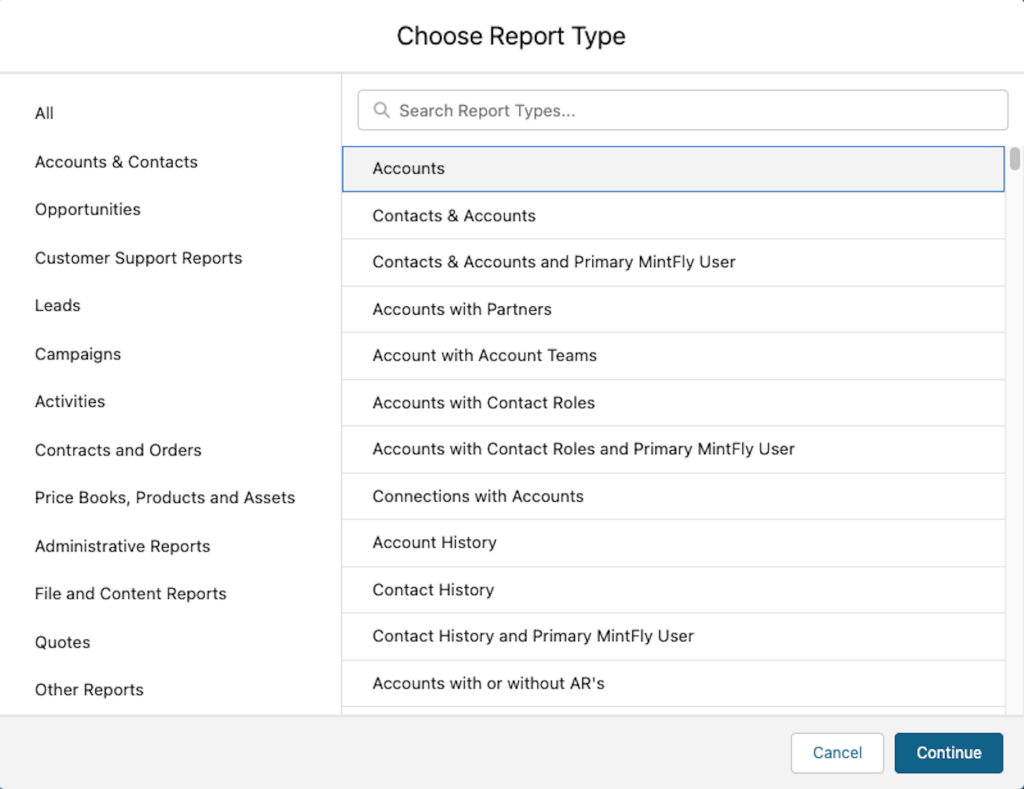
2. Then choose the sales activity report you wish to create. For this example, choose Tasks and Events as the report type.

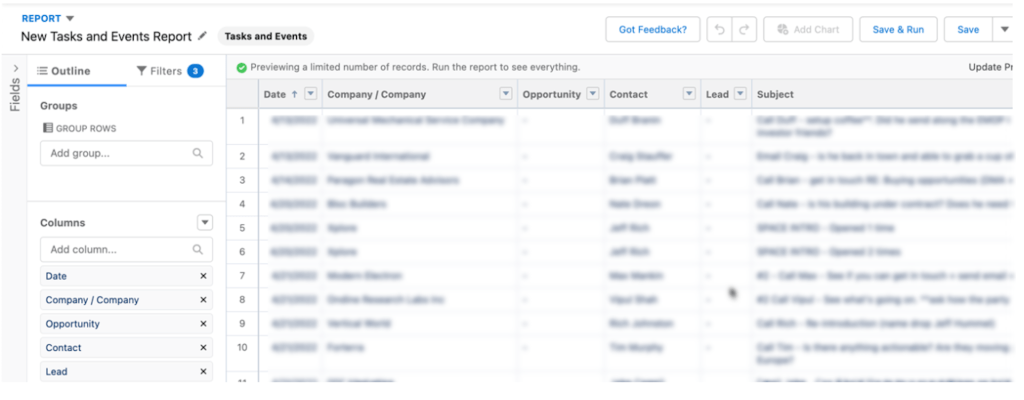
3. Once there, you’ll see a screen divided into sections: Fields, Filters, and Preview. The default fields for the activity report type you selected are shown in the “Preview” section.

4. If you wish to add more fields to the activity report, look through the “Fields” section. To include the fields in your report, drag them into the “Preview” section. The “Remove Column” option is available when selecting the drop-down menu next to a field’s name from the drop-down menu next to the field’s name.
5. If you want to see only a subset of the data in your report, use the Filters section. You may input additional filters by clicking the “Add” button next to Filters in the report’s toolbar.
6. View the report by clicking “Run Report” in Salesforce.
7. When you’re happy with the report, save it. Make sure to choose an appropriate folder so other people can use all your hard work.
Following these steps will allow you to run any custom sales activity report. It will be possible for your team to look at data in a range of page layouts and representations to gain the most excellent understanding of the data.
Examples of Sales Activity Reports
Now that you know the basics, let’s get into the details. What activities actually matter for my team and my metrics? Unfortunately, we can’t answer that for everyone. Everybody’s business is different, so we recommend sitting down with your team (or just on your own whiteboard) and designing the perfect dashboard. Decide what metrics you think to affect your business goals and start with those reports on a dashboard.
But we do see some common requests. Here are some tips and tricks on how to create some of our most requested sales activity reports:
Number of Calls Made
Why does it matter?
For sales teams that still rely on a lot of phone calls, this is often an early indicator of the future pipeline. Put this leading indicator on your dashboard and watch for weeks when it dips and see how it correlates to pipeline growth in future periods.
How do I report on it?
Create a Tasks and Events report and apply the appropriate filters to search for how you’re logging calls. Review the results and make sure they are accurate.
Then group the Activity Date by week, month, or whatever period makes sense for your team.

Conversation Rate
Why does it matter?
Note: this is not conversion rate, although it’s similar.
If you know that 5% of your calls end up in a conversation and that 10% of your conversations result in someone moving forward, then you can work backward and see how many calls you need to make in order to meet your target for the pipeline growth.
How do I report on it?
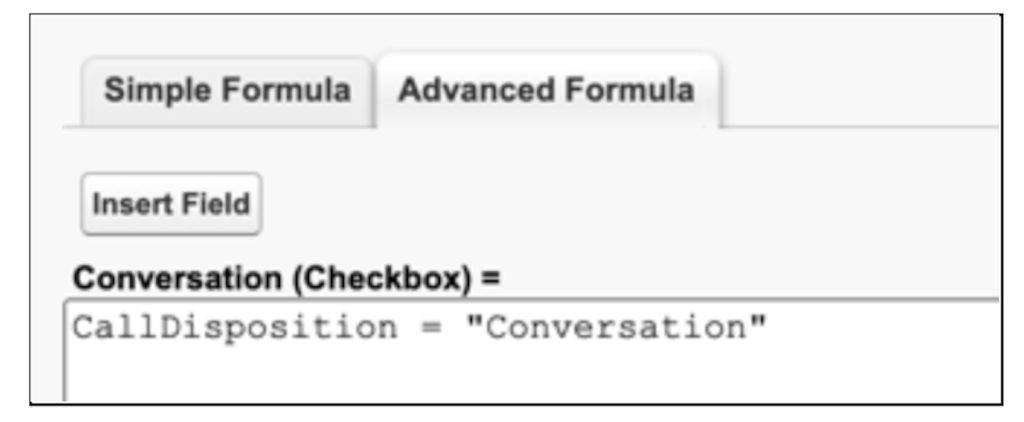
The key here is to have a field on the activities that tells you if this one was a conversation. To do this, we create a formula field in Setup > Object Manager for Activities. This field is a checkbox formula, and it needs to return TRUE if the activity should be considered a conversation. For this example, we’ll base it on the Call Result field, so this is what the formula looks like:

Now, create a report just like any Tasks and Events report and adjust the filters to get the right data range, team, and anything else you want to filter on. Make sure that you don’t filter to just the conversations, you want all calls that meet your criteria.
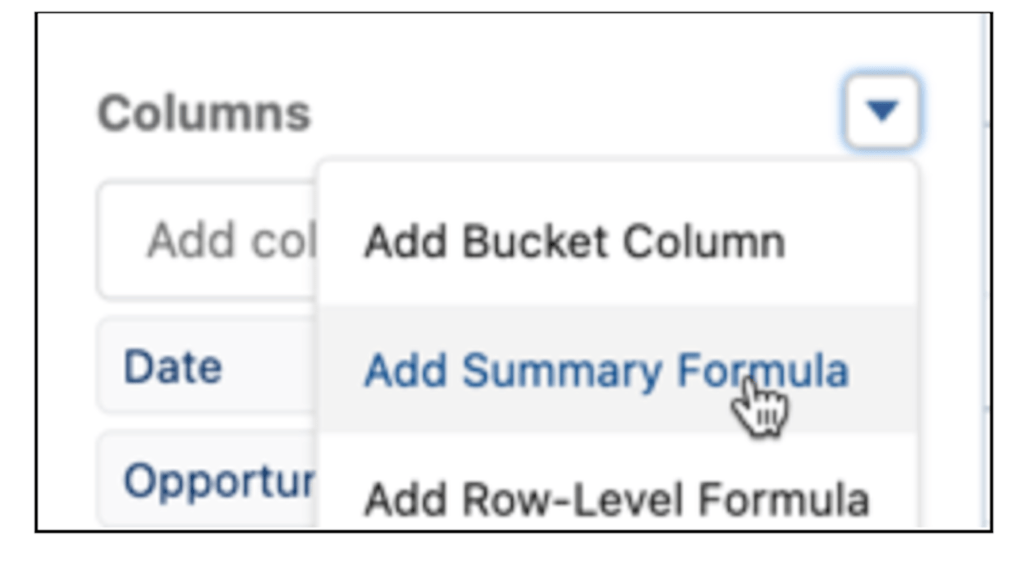
Now, the next tip: create a custom summary formula for conversation rate. On your report, click on the drop-down next to the columns and click Add Summary Formula.

Then enter the following formula (assuming your formula field is named Conversation).
That’s it, now you can see what % of your calls result in conversations. You can use this similar method to create all kinds of conversion rate reports – for example, what % of leads are converted can be done with just a summary formula with the Converted field that is already in Salesforce.
Activity Leaderboards
Why does it matter?
In some organizations, competitiveness can be a huge contributor to sales motivation. A dashboard that shows sales stats based on team or individual can be a great tool to increase results.
How do I report on it?
Just create any activity report and group it by the User or Role and add it to a dashboard!
Other Activity Reports to Consider
The AppExchange is a great resource for looking for reports and dashboards that can be used for ideas or as starting points for your team. To get you started, here are a few more requests that we get:
- Email open rates – If you’re interested in detailed stats I recommend one of Salesforce’s email partners, but you can also get some stats from the HTML email status reports.
- Opportunity pipeline updates – want to know when deals skip straight to close from an early stage? Or how many deals were lost last week? Using the Opportunity History report you can report on important changes to Opportunities.
- Meeting close rate – This one often requires tracking the meeting outcome which a lot of teams don’t do. But if your sales process is quick and often relies on key meetings to close (demos, on-site evaluations, consults, etc), then this is a critical metric to track. Just set up a custom field on the Event to track what happened (Moved to Opp, Undecided, Not Interested, etc) and create a report based on it.
How to Get Started
Get the appropriate people together and figure out your business metrics, or at least what you think they are to start. Don’t let perfection get in the way of creating something that you can start using soon.
Then start building. Use the examples above and the AppExchange as inspiration. If you have existing reports that you’re manually preparing for a company or board presentation, use those for ideas too, even better if you don’t have to spend time manually putting together charts after moving reports to Salesforce.
Reporting on Sales Activity can be frustrating due to the complexity of capturing and reporting on all the different things going on, but being able to find the pulse of your sales team is priceless. We hope these ideas have inspired you to create some powerful reports. If you have any questions, feel free to start a chat with us – it’s on this page to the lower right!
If you ever need to email these reports to people, make sure to check out our Report Sender app, the easiest way to send reports to non-Salesforce users.
