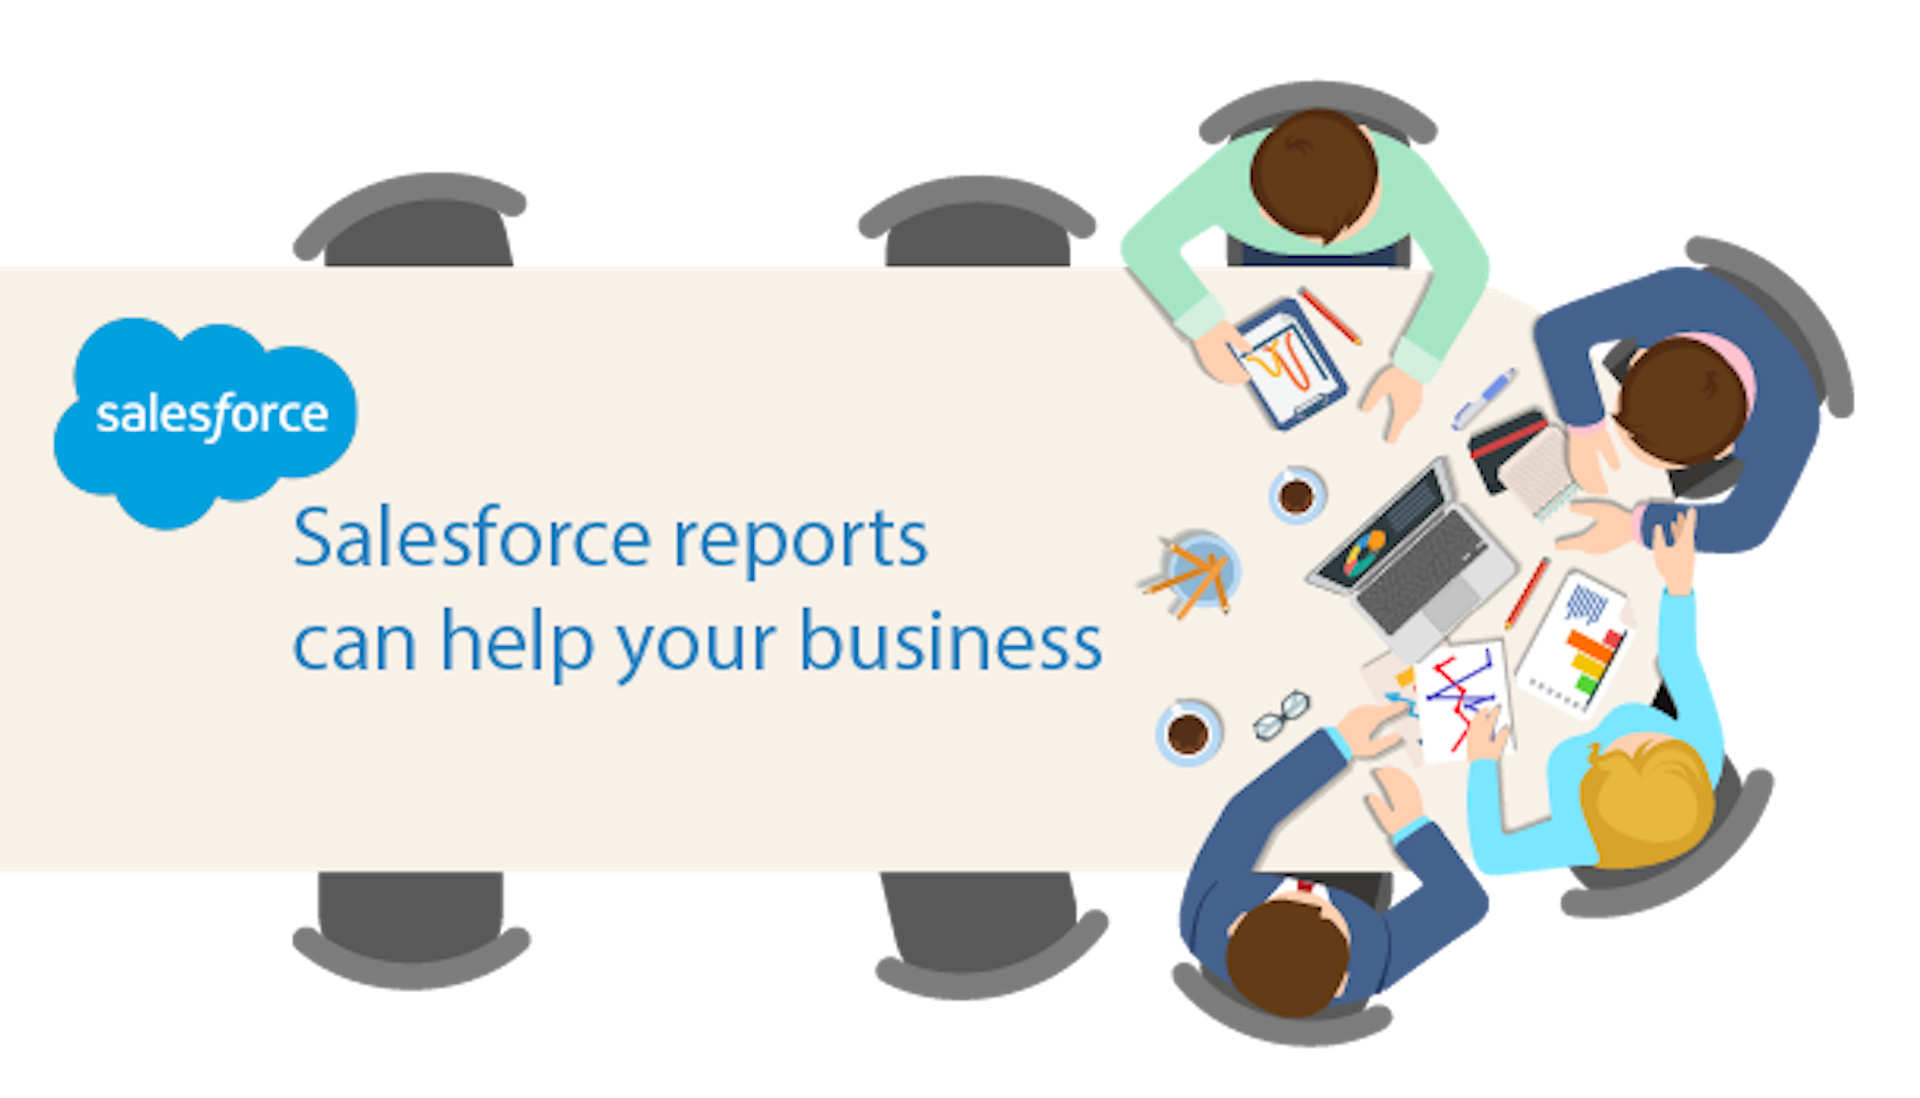
Since Salesforce came into the scene, it has helped businesses measure their growth and other key metrics. Shared reporting has also helped to create a sense of unity amongst team members. If you’re not in on it yet, this article will show you reporting basics that could help your team.
What is a Report?
We know that information helps a business to thrive. That’s why presenting information in an accessible format is vital. When data is presented in an easy and clear format, the essential details become hard to miss. Presenting a data set with ease is precisely what a report does.
A Salesforce report is a document that contains organized data from Salesforce. Salesforce has several options for formatting tabular data within the report. Salesforce reports can also include charts or graphs that summarize the report data.
There are many reporting tools out there, Salesforce even has multiple options like Einstein Analytics and Tableau. For this article, we’ll be mostly talking about the capabilities of Salesforce’s built-in reporting tool.
What are the standard reports in Salesforce?
When presenting data in the form of a Salesforce report, you want to be sure that you’re using the best format for your business. There are four types of Salesforce reports, and each performs distinct functions and is more suited for different forms. Before you decide which works best for you, determine what you’re trying to communicate through your reports. These four enable you to pull, send, and review data. Below, we discuss the types of reports in Salesforce in detail.
Tabular
The tabular format is the simplest and basic form of salesforce reporting. This will be the default format when creating a report in Lightning Experience. It is essentially a display of records in a tabular form. These are most effective when you want to export the data. However, don’t consider them for data manipulation like calculations or groups of data.
Summary
Summary reports are most suitable for grouping rows of data. That means you can group data according to any field and proceed to calculations: totals, maximums, minimums, averages, or custom formulas. If you want to specify the accounts that bring more revenue, what services and products clients purchase more, the summary reports are the best option.
Matrix
This report type is very much like the summary option. However, while a summary report is done according to rows, matrix reports function according to rows and columns. It is better to use them for more complex data since you can use them to determine several totals. They are effective for large data or huge amounts of complex information.
Joined
Joined reports are best for comparison. They help create separate reports and then compare individual datum. Although they are not common, they are most effective for learning the differences between accounts.
How to use reports in Salesforce
Effective report management includes careful attention to details, data quality, security, and more. So to use reports in Salesforce, make sure you’re providing answers to questions and offer solutions. How?

How to create Salesforce reports
- Login to Salesforce

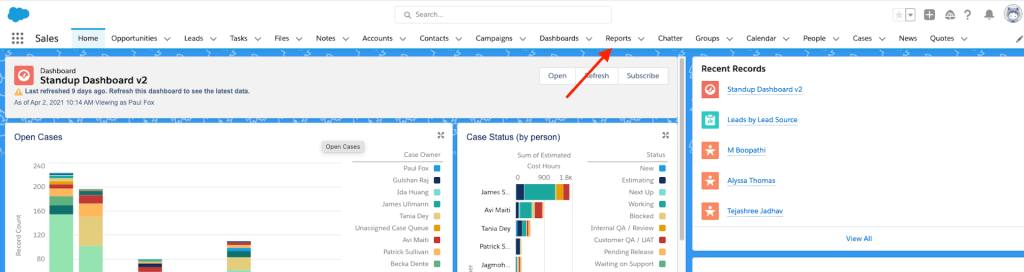
2. Select the reports tab. If you don’t see it, use the app launcher to search for it.
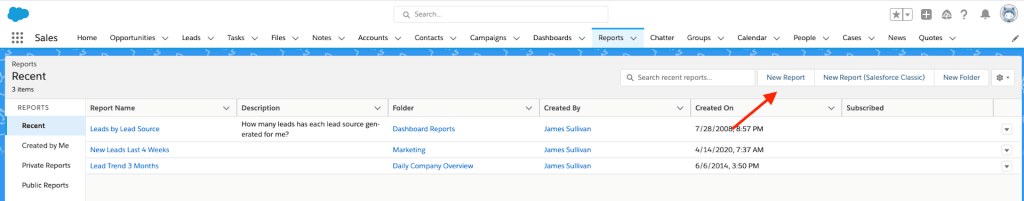
3. Click New Report
4. Choose the Report Type. This is a critical step because the report type determines the objects and fields that will be available in your report. If you don’t see the right option, look into creating a Custom Report Type.
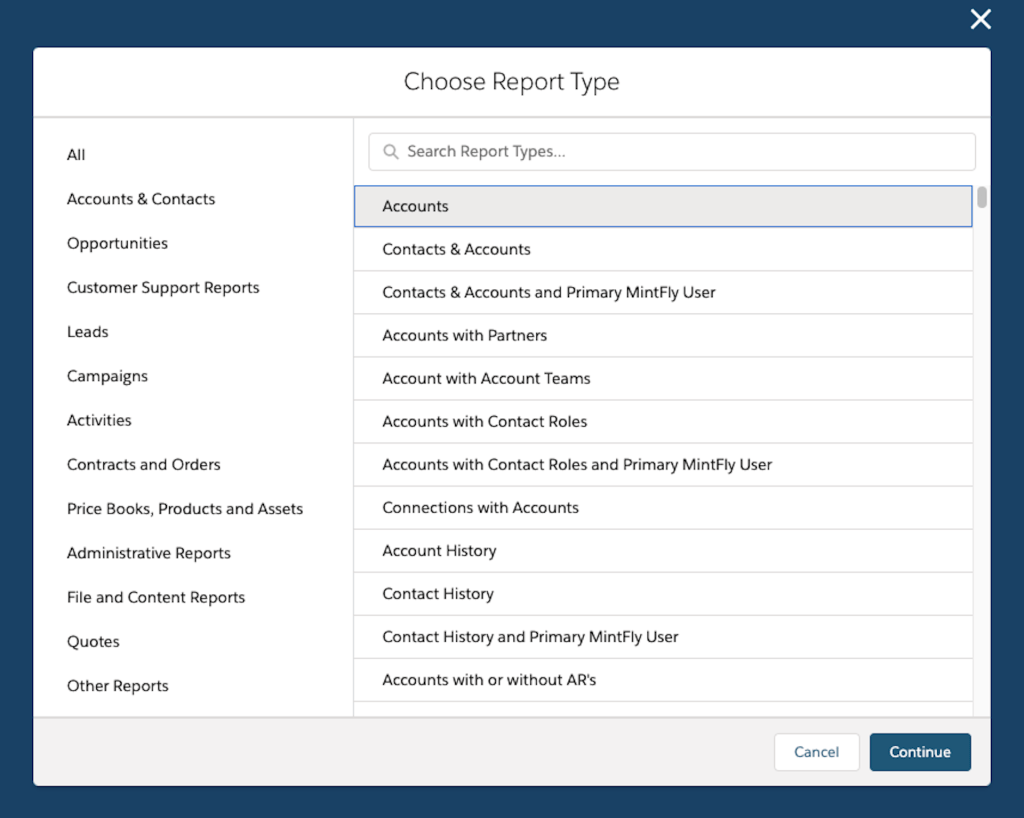
5. Click on Continue to go to the report builder.
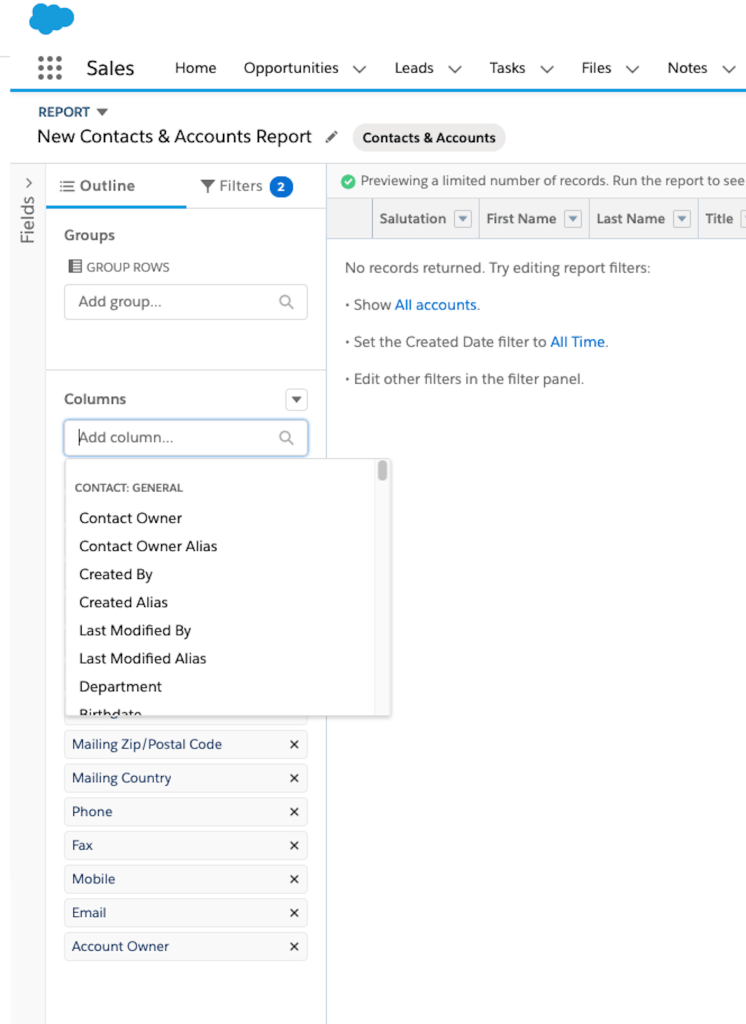
Now you will be in edit mode, with a preview. The edit mode allows you to add and remove fields, elements, group rows, and columns. You can also filter report data and show or hide a chart or tailor the report according to your needs.
6. To add new columns, click on the “Add column” feature. Search and select field status – either scroll or type in the desired field. You can also expand or contrast the Fields pane. Then drag-and-drop or double-click a field.
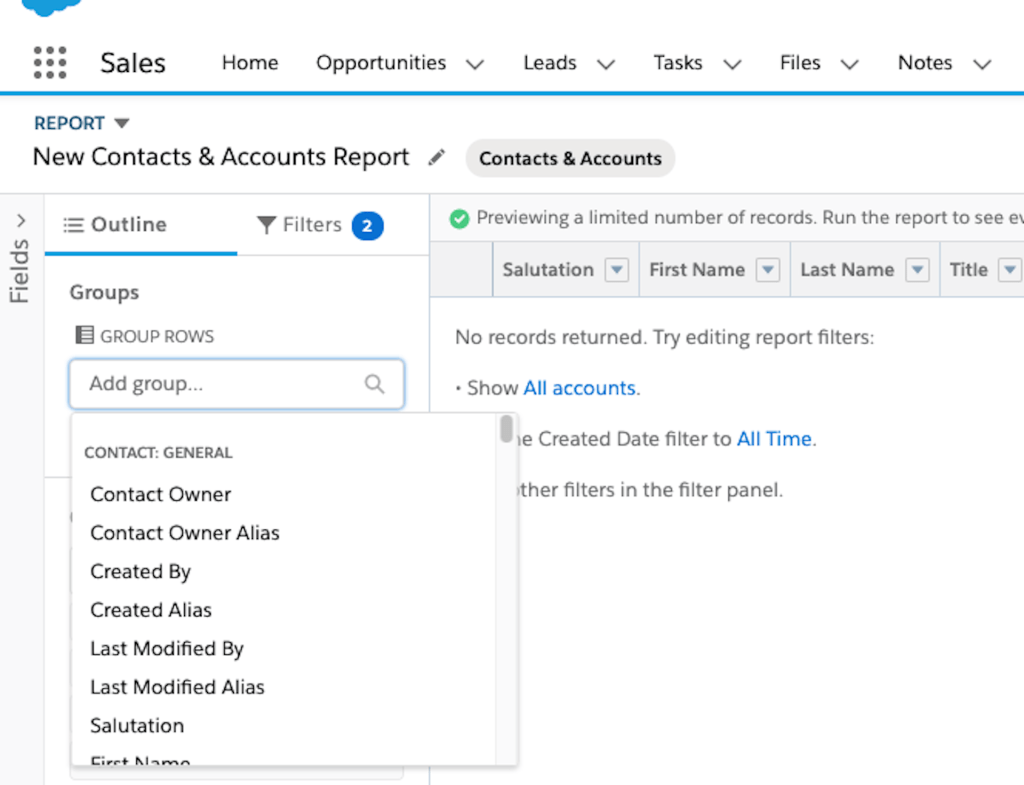
7. For record grouping, choose the element “Add group” and select the field to group by. Or from the preview window, find the rows you want to group and select “Group Rows”. You now have a Summary report.
8. After you’ve grouped by rows or columns you can choose any numeric fields to be able to aggregate them. Just click the drop-down next to a field and click Summarize then choose Sum/Average/Max/Min.
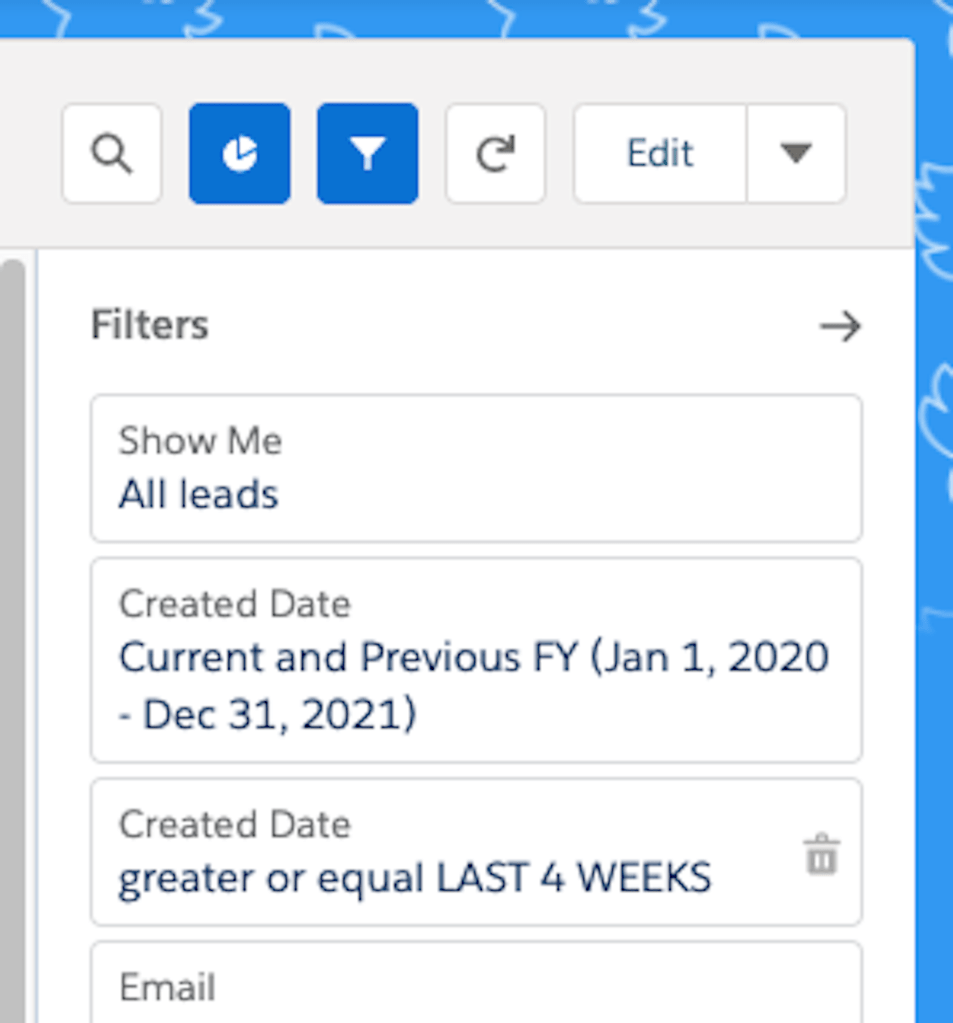
9. To be sure that you’re viewing the desired data by updating your filters: Click on filters. Change the default filters if needed. Often you’ll want to change the date filter and the “Show Me” filter. Add any additional filters needed.
10. Save and name your report.
11. Folders determine who can see the report, so put it in the correct folder. Private reports are only visible to the user that saved them. Public reports are visible to anyone that can run reports. Keep in mind that reports always respect user permissions so people cannot see data in a report that they can’t see normally.
Sharing Salesforce reports
Now that you have a fancy new report, how do you make it available to the people that need it? Well, that depends a lot on how the report will be used, so here are some of your options:
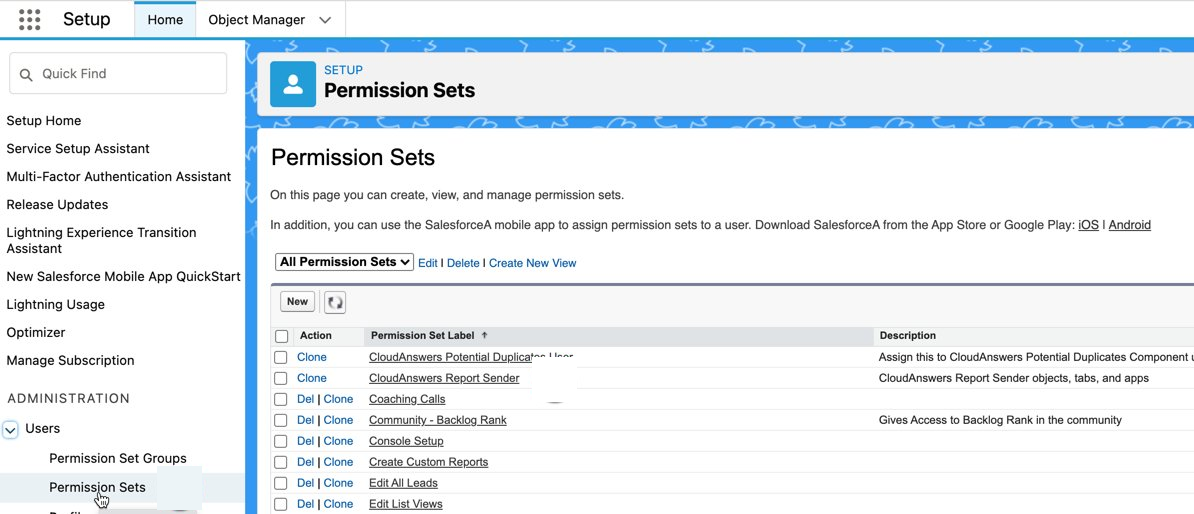
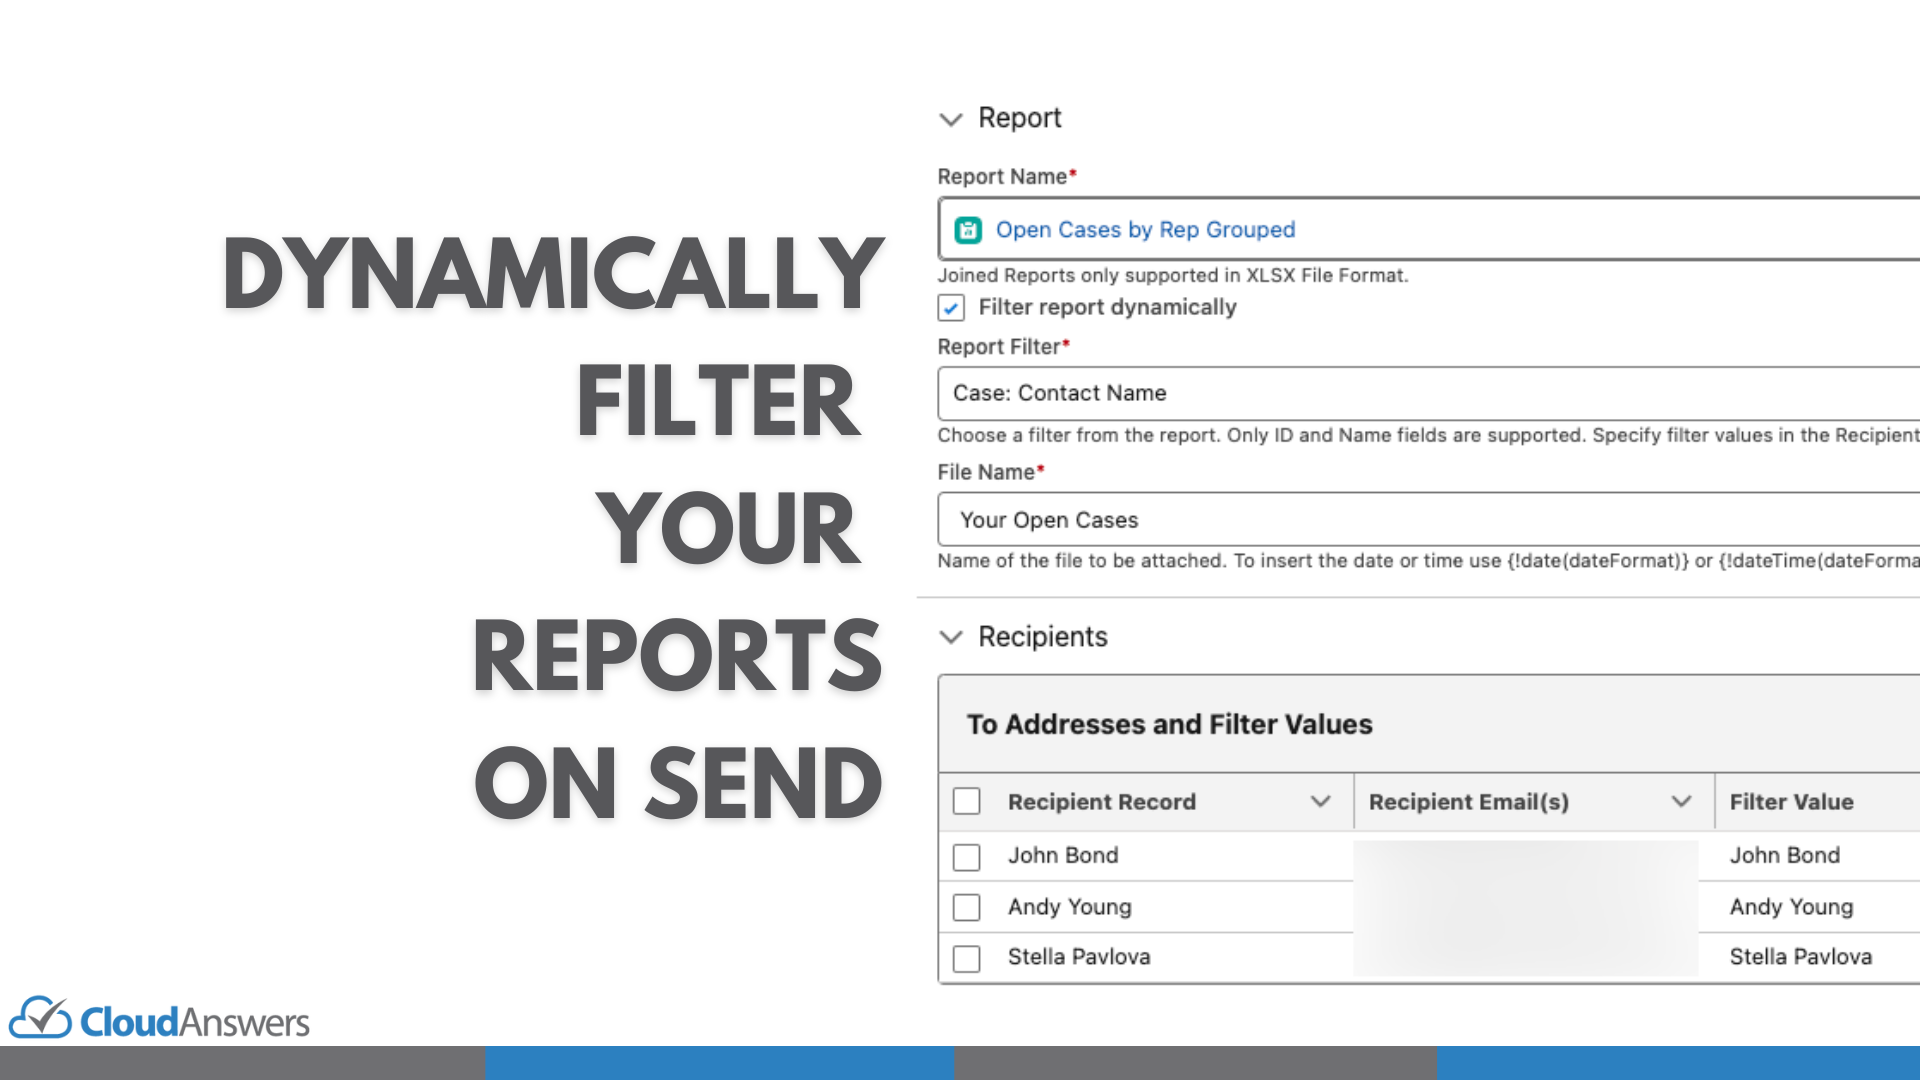
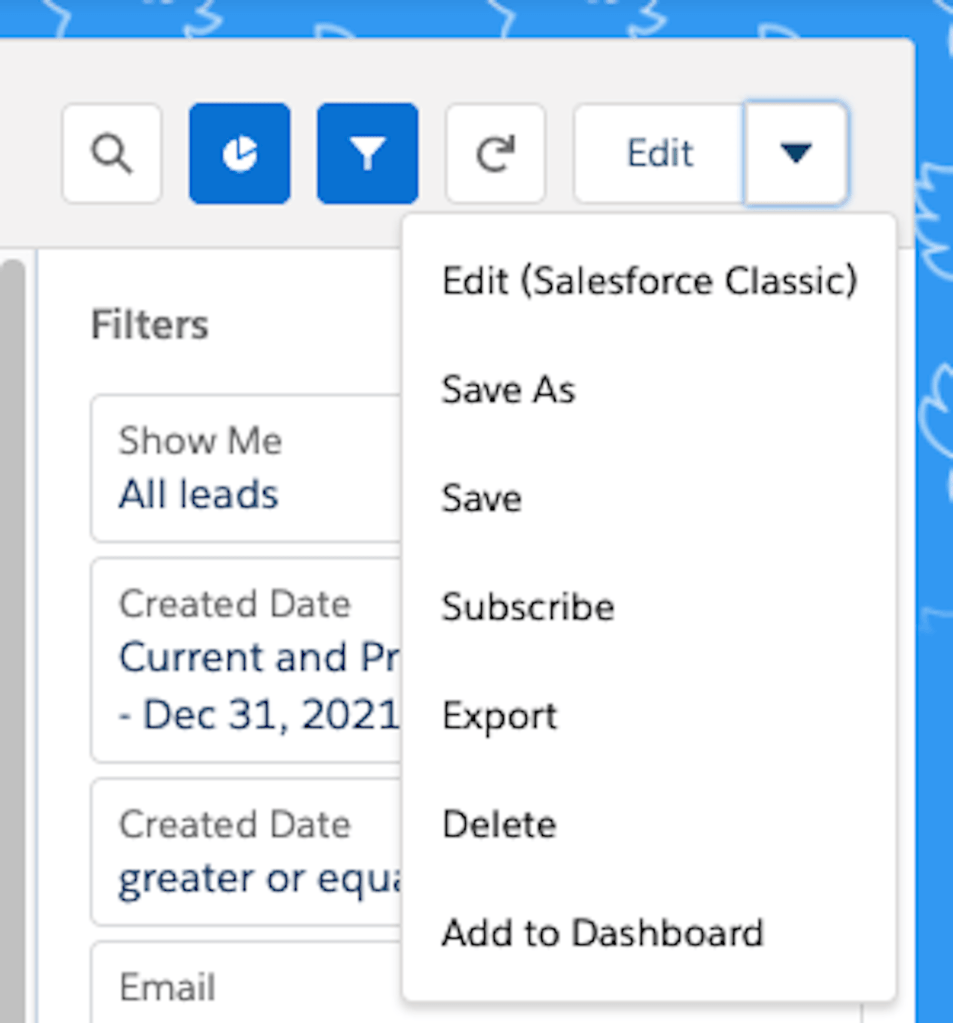
- Setup the report to be sent on a schedule: One of the best ways to make sure a report is used is to automatically send it to the right people. If you just want to send it to yourself, click the Subscribe button and choose your schedule. If you want to send it to other people you’ll have to do it manually or use an AppExchange app like the CloudAnswers Report Sender. Our app lets you schedule the report to be delivered to any email address on a schedule you choose.
- Send people a link to the report: The easiest way to share, just to email someone a link to the report and they can open it as long as they have a login to Salesforce, access to the report folder, and access to the objects and fields that are used in the report.
- Put it on a dashboard: Dashboards are a great way to gather multiple report charts into one organized view. Put several reports together into a dashboard that people can explore and drill into the reports.
What Now?
- Need help with reporting? Contact Us
- Want to check out Report Sender? See it on the AppExchange
Want to learn more about reporting? Check out Trailhead
Check also: Salesforce reporting tips and best practices