If you’ve spent any time working with Salesforce reports at scale, you’ve probably run into some slow reports. Maybe it showed up when you tried to run a report manually. Maybe you had problems exporting reports. Or maybe your dashboard just says “Error: The component can’t be displayed because the source report failed to run.” Same root cause, different messenger.
The frustrating part is that the report might have worked perfectly fine six months ago. Nothing about the report itself changed. The data underneath it grew, and now it takes too long for Salesforce to process. This is one of those problems that sneaks up on you as your org matures, and it’s one of the most common performance issues admins deal with.
Let’s break down exactly why this happens, what the actual limits are, and what you can do to fix it: from quick wins to the nuclear options.
Report Timeout Limits
When you run a report in Salesforce, the platform executes a database query behind the scenes. That query has to scan your data, apply your filters, join related objects, compute any formulas, group the results, and return the results in a formatted output. All of that work has to happen within a fixed time window.
Here’s where the limits come in:
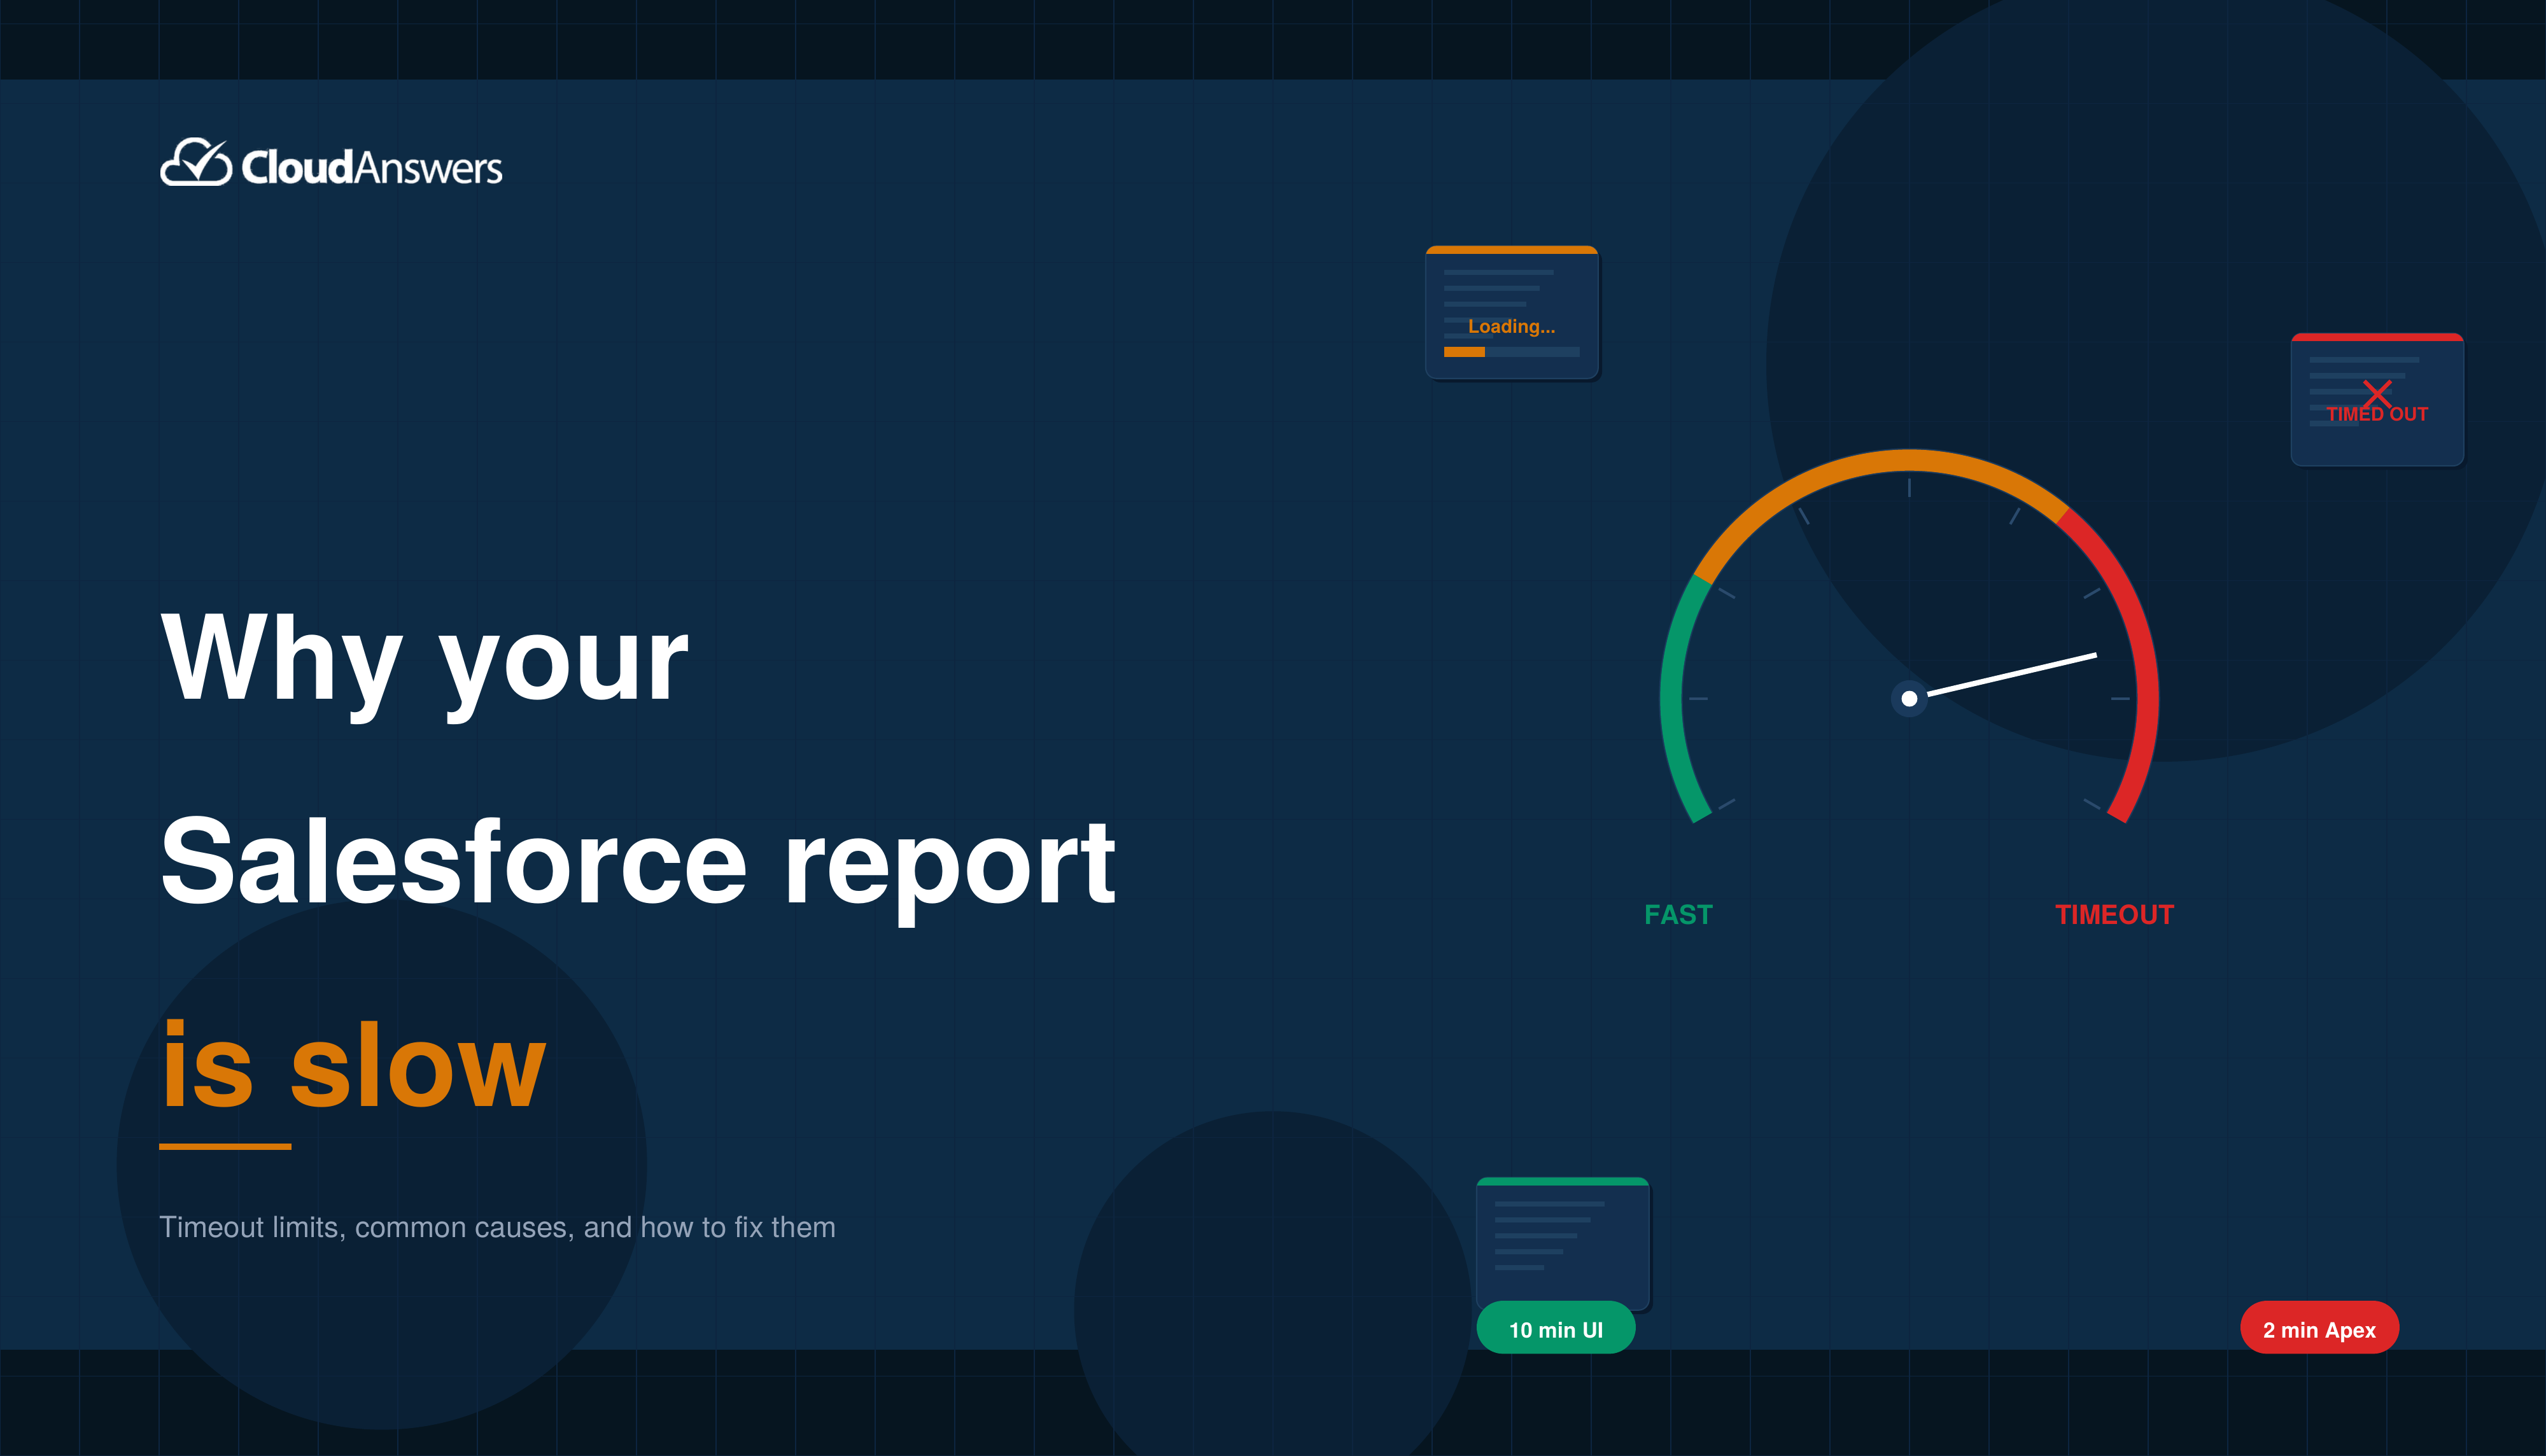
For reports run in the UI, Salesforce imposes a 10-minute timeout. If the report doesn’t finish processing within 10 minutes, it fails. You can contact Salesforce Support to extend this to 20 minutes for tabular, summary, and matrix reports, but joined reports are stuck at 10 minutes with no extension available.
For our Report Sender tool and other native apps, which query the reporting API from Apex, there’s a 2-minute callout limit. Technically, there are two overlapping constraints: the maximum timeout per callout is 120 seconds, and the maximum cumulative timeout across all callouts in a single Apex transaction is also 120 seconds.
It’s important to note that this 2-minute limit applies specifically to native apps running inside the Salesforce platform as Apex code. External systems that call the Reporting API directly (such as a BI tool connecting from outside Salesforce) receive the standard 10-minute REST/SOAP API timeout, the same as the browser UI. So report timeout problems are most acute for native AppExchange apps and internal Apex-based automations, not for external integrations.
Why Your Report Is Slow in the First Place
Understanding what makes a report slow is the key to fixing it. It’s almost never just one thing; it’s usually a combination of factors that stack up until the report crosses a timeout threshold.
The Object Has Too Many Records
This is the most common culprit. As a general rule of thumb, when an object grows past 100,000 records, report performance starts to become a concern, though the exact tipping point depends heavily on your query complexity, how many fields are involved, and whether your filters hit indexed fields.
Past a million records, timeouts become increasingly common regardless of optimization. Even if your report only returns 50 rows, Salesforce still has to scan a much larger set of data to find those 50 rows. The bigger the haystack, the longer it takes to find the needles.
Activity objects (Tasks and Events) are especially prone to this because they accumulate rapidly. Any report type that queries Tasks (including “Accounts with Activities” or “Contacts with Activities”) tends to be slower than reports on other objects, simply because of the sheer volume.
Soft-deleted records sitting in the Recycle Bin also impact performance. Even though they don’t appear in your report results, they still live in the database and must be filtered out during query execution. If your org has a large volume of deleted records that haven’t been permanently purged, that’s silently adding overhead to every report.
Your Filters Aren’t Selective Enough
Filters are the single most impactful lever you have for report performance. A report with no filters (or with very broad filters, such as “Created Date: All Time”) forces Salesforce to scan the entire object. A report with a selective filter, such as “Created Date = THIS MONTH,” on an indexed field narrows the scan dramatically.
The keyword there is indexed. Salesforce automatically indexes certain fields: Id, Name, RecordTypeId, CreatedDate, SystemModstamp, Division, Email (on Contacts and Leads), and all foreign key relationships (lookups and master-detail fields, which include the Owner field).
Custom fields marked as External ID or Unique are also automatically indexed. This is worth knowing because if you’ve set up External ID fields for integrations, you can also use them as high-performance report filters. When you filter on an indexed field, Salesforce can use the index to jump directly to the relevant records instead of scanning every row. When you filter on a non-indexed field, it has to read every record and evaluate the filter one by one.
Having an index on a field doesn’t guarantee it’ll be used, though. The query optimizer uses an index only if the filter is selective enough, meaning it narrows the result set to a small fraction of the total records. If your filter matches too many records, the optimizer ignores the index and does a full scan instead.
Also, filter operators matter. Using EQUALS is much faster than CONTAINS because EQUALS can leverage indexes, while CONTAINS requires character-by-character evaluation across every record. The same goes for DOES NOT CONTAIN; it’s essentially asking Salesforce to read every record and check a condition, which is as expensive as it gets.
Too Many Columns, Formulas, and Cross-Object References
Every column you add to a report adds work. More columns mean more data to retrieve, more fields to process, and, behind the scenes, potentially more database joins to perform.
Salesforce stores standard fields and custom fields in separate internal tables. When your report includes both standard and custom fields (which most reports do), the database has to join the tables. The more fields you include, the more joins are required, and the slower things get.
Report formulas and bucket fields are evaluated at runtime when the report is generated. Object-level formula fields are also calculated dynamically (they’re not precomputed and stored like rollup summary fields), but there’s a key difference in where and how that calculation happens. Object formula fields are evaluated by the database engine as part of the query itself; the formula logic is embedded in the SQL that Salesforce generates.
Report formulas, on the other hand, add a separate computation layer during report rendering, after the data has been retrieved. If your report returns 50,000 rows and has three report formulas, that’s 150,000 additional calculations during report generation. Moving those calculations into formula fields on the object, rather than report formulas, shifts the work to the database engine, which is generally more efficient.
The Report Type Involves Multiple Objects
Reports that span multiple objects, such as “Accounts with Opportunities with Products”, require the database to join those objects. Each additional level of object relationship adds complexity to the underlying query. If each of those objects has a large number of records, the join operations can become extremely expensive.
Custom report types that include “with or without” relationships are particularly heavy because they produce outer joins, requiring the database to find matching records and include records without a match, which is computationally more intensive than a simple inner join.
Timing and Shared Resources
Salesforce is a multi-tenant platform. Your org shares infrastructure with thousands of other orgs. During peak usage hours (typically between 9 AM and 5 PM in major time zones), there’s more contention for resources, and reports that run fine at midnight might timeout at 2 PM.
This also explains why timeout errors can be inconsistent. The same report might take 3 minutes one day and fail after 10 minutes the next. It’s not that your data changed; it’s that server load varies throughout the day.
How to Fix It: Quick Wins
Start with these optimizations. They’re easy to implement, don’t require Salesforce Support, and often resolve the problem entirely.
1. Tighten Your Filters
This is the highest-impact change you can make. Go through every filter in your report and ask: Can I make this more specific?
Switch from “All Time” to a specific date range. Use “THIS QUARTER” or “LAST 90 DAYS” instead of open-ended ranges. If you’re using CONTAINS, switch to EQUALS where possible. Remove any “DOES NOT CONTAIN” or “NOT EQUAL TO” filters that aren’t strictly necessary, as these prevent index usage.
If you’re filtering on a field that isn’t indexed and you can’t change the filter, consider asking Salesforce Support to add a custom index on that field. You’ll need to open a case and provide a business justification, but for frequently filtered fields on large objects, it can make a dramatic difference.
2. Remove Unnecessary Columns
Open your report in edit mode and look at every column. Do you actually need all of them? Every column you remove reduces the work Salesforce has to do. This is especially true for columns that come from related objects, since each one adds a join.
If you’re using the report for a dashboard component, you often need far fewer columns than you think; the chart only uses the grouping and summary fields.
3. Replace Report Formulas With Object-Level Formula Fields
If your report has custom summary formulas or row-level formulas, try replacing them with formula fields defined directly on the object. Both are calculated dynamically, but object-level formulas are evaluated by the database engine as part of the query, while report formulas add a separate processing step during report rendering.
On a report with tens of thousands of rows, this difference is significant. For even better performance, consider whether the value could be computed by a Flow or trigger and stored in a regular field. That way, the calculation happens once on save, not every time the report runs.
4. Switch the Report Type
Sometimes the same data can be retrieved through a different, lighter report type. If you’re running an “Accounts with Activities” report, consider whether a simpler “Tasks” report filtered by Account fields would give you the same information with less overhead. Fewer joined objects means fewer database joins, which means faster execution.
5. Hide Report Details
If you only need summary data (totals, counts, averages), turn off “Show Details” in the report settings. When details are hidden, Salesforce can optimize the query to compute only aggregates rather than retrieve and return every individual row.
6. Schedule Reports for Off-Peak Hours
If you’re scheduling reports to be emailed to stakeholders, set them to run during off-peak hours (typically between 6 PM and 3 AM in your org’s primary time zone). Less server contention means faster processing, which means fewer timeouts.
How to Fix It: The Heavier Solutions
If the quick wins don’t get you under the timeout threshold, it’s time for the bigger interventions.
Custom Indexes
Salesforce automatically indexes standard fields, but it doesn’t index custom fields by default. If your report filters heavily on a custom field (such as a Status picklist or a Region field) and that custom field is on an object with hundreds of thousands of records, a custom index can dramatically improve performance.
To get a custom index, open a case with Salesforce Support. Provide the object API name, the field API name, and explain the business use case. Salesforce will evaluate whether the field is a good candidate for indexing. Not every field qualifies; the field needs to be reasonably selective (meaning the filter narrows results to a relatively small subset of records) for an index to help.
Skinny Tables
Skinny tables are one of Salesforce’s most powerful (and least known) performance tools. Here’s the problem they solve: Salesforce internally stores standard and custom fields in separate database tables. Every report that includes both standard and custom fields requires a join between those tables, and that join gets expensive at large data volumes.
A skinny table is a pre-joined, read-only copy of a specific set of fields from an object, stored in a single flat table. Because no joins are needed, queries against a skinny table are significantly faster. Skinny tables also exclude soft-deleted records (records in the Recycle Bin), which further reduces the data volume the database has to work with.
The catch: you can’t create skinny tables yourself. You have to contact Salesforce Support, tell them which object and which fields you need, and they’ll set it up. If you later need to add fields, you have to contact them again. There are also hard constraints to be aware of: skinny tables can contain a maximum of 200 columns, and they can’t contain fields from other objects.
That means if your report’s slow performance is caused by cross-object joins, skinny tables won’t help with that specific problem. Skinny tables are also only copied to Full sandbox environments, so for other sandbox types, you’d need to contact Support to activate them separately.
For orgs with objects containing millions of records that consistently time out, skinny tables are often the thing that finally solves the problem. Ask your account rep or open a case with Support to discuss whether your org qualifies.
Split the Report
Sometimes a single report is trying to do too much. If you have a report that covers all Opportunities for all time, across all regions, with 20 columns and three summary formulas. That’s a lot of work for the database.
Consider splitting it into multiple reports: one per region, or one per quarter. You can then add them to a dashboard as separate components to get a combined view, or schedule them individually so each one stays within its timeout window. It’s not elegant, but it works.
Move Calculations Out of Reports Entirely
If you need complex aggregations that push reports past the timeout (like year-over-year comparisons, weighted averages, or multi-level rollups), consider whether the report is really the right tool. Sometimes the better approach is to pre-calculate these values using Flows, rollup summary fields, or batch Apex, and then store the results in fields that a simple report can reference.
For example, instead of a report that calculates “total revenue per Account over the last 12 months” by scanning hundreds of thousands of Opportunity records, create a scheduled Flow that computes that number nightly and stores it on the Account record. Then your report just reads a single field: no calculation, no join, no timeout.
When the Report Truly Can’t Be Fixed
Sometimes, despite all optimization efforts, a report simply can’t be completed within Salesforce’s time limits. The data volume is too large, the relationships are too complex, or the business requirements demand more than the reporting engine was designed for. At that point, you have a few paths:
Einstein Analytics / Tableau CRM / CRM Analytics (Salesforce keeps renaming it) is built for large-scale data analysis. It uses a separate analytics engine that pre-processes data, so queries run against an optimized dataset rather than the live transactional database. It can handle much larger data volumes without timeouts.
Tableau is Salesforce’s full-featured analytics platform. If your reporting needs have outgrown native Salesforce reports, Tableau provides the horsepower to perform complex analysis on massive datasets. There are several reporting tools in the ecosystem worth evaluating.
Data Warehousing is the most scalable approach. Export your Salesforce data to an external data warehouse (we typically use Snowflake, but there are plenty of options, including BigQuery and Redshift) and run your reports there with no timeout constraints. This requires setup and maintenance, but it’s the definitive solution for organizations that have genuinely outgrown Salesforce’s native reporting limits.
How This Affects Report Sender Users
Since we built Report Sender, we have seen this issue a lot. It’s worth explaining exactly what happens and how we handle it.
Report Sender is a native Salesforce app, which means it runs as Apex code inside your org. When it generates a scheduled report, it calls the Salesforce Reporting API to retrieve the report data. That API call is subject to Salesforce’s 120-second Apex callout limit, a hard platform governor limit.
If the report takes longer than 2 minutes to process, Salesforce kills the connection, and Report Sender receives a “Read Timed Out” error. When that happens, Report Sender sends you an error notification email so you know what happened, and then automatically retries the report. By default, it retries immediately, which we’ve found works well for reports that are right on the edge of the 2-minute window (server load fluctuates, and a retry that runs a few seconds faster can often succeed).
You can also configure the retry behavior: set how many retries you want, and whether to retry immediately or wait. If a report consistently fails even after retries, that’s a signal that the report itself needs optimization using the techniques described above.
A Quick Checklist
When you get a report timeout, work through this list:
Check the data volume. How many records does the underlying object have? Large objects (100K+ records) are more likely to cause timeout issues, especially with complex queries. You can find record counts in Setup > Storage Usage.
Review the filters. Are they on indexed fields? Are they selective enough to narrow the result set? Can you use EQUALS instead of CONTAINS?
Count the columns. Do you need all of them? Remove anything the report’s audience doesn’t actually use.
Look for report formulas. Can any of them be replaced with formula fields on the object, or better yet, with stored fields populated by a Flow or trigger?
Simplify the report type. Can you use a different report type with fewer object joins?
Check the time of day. Is the report running during peak hours? Try scheduling it for early morning or evening.
Try running it manually. If it completes in the browser (10-minute window) but fails via a native app (2-minute Apex callout window), the goal is to optimize it to under 2 minutes.
Consider custom indexes or skinny tables. If you’ve exhausted the self-service options, contact Salesforce Support.
Wrapping Up
Slow report issues aren’t mysterious once you understand the mechanics. Salesforce imposes hard time limits on report execution: 10 minutes for browser-based reports and external API calls, 2 minutes for native Apex-based apps. When your data volume grows beyond what those windows can accommodate, the report fails. Don’t wait until your reports are failing. If you notice reports are loading slowly, try and apply some of these techniques to speed it up.